

Solar Power Knowledge
Commercial Solar ROI for Warehouses: How to Calculate Payback Before You Sign Anything
 gaotu
gaotu
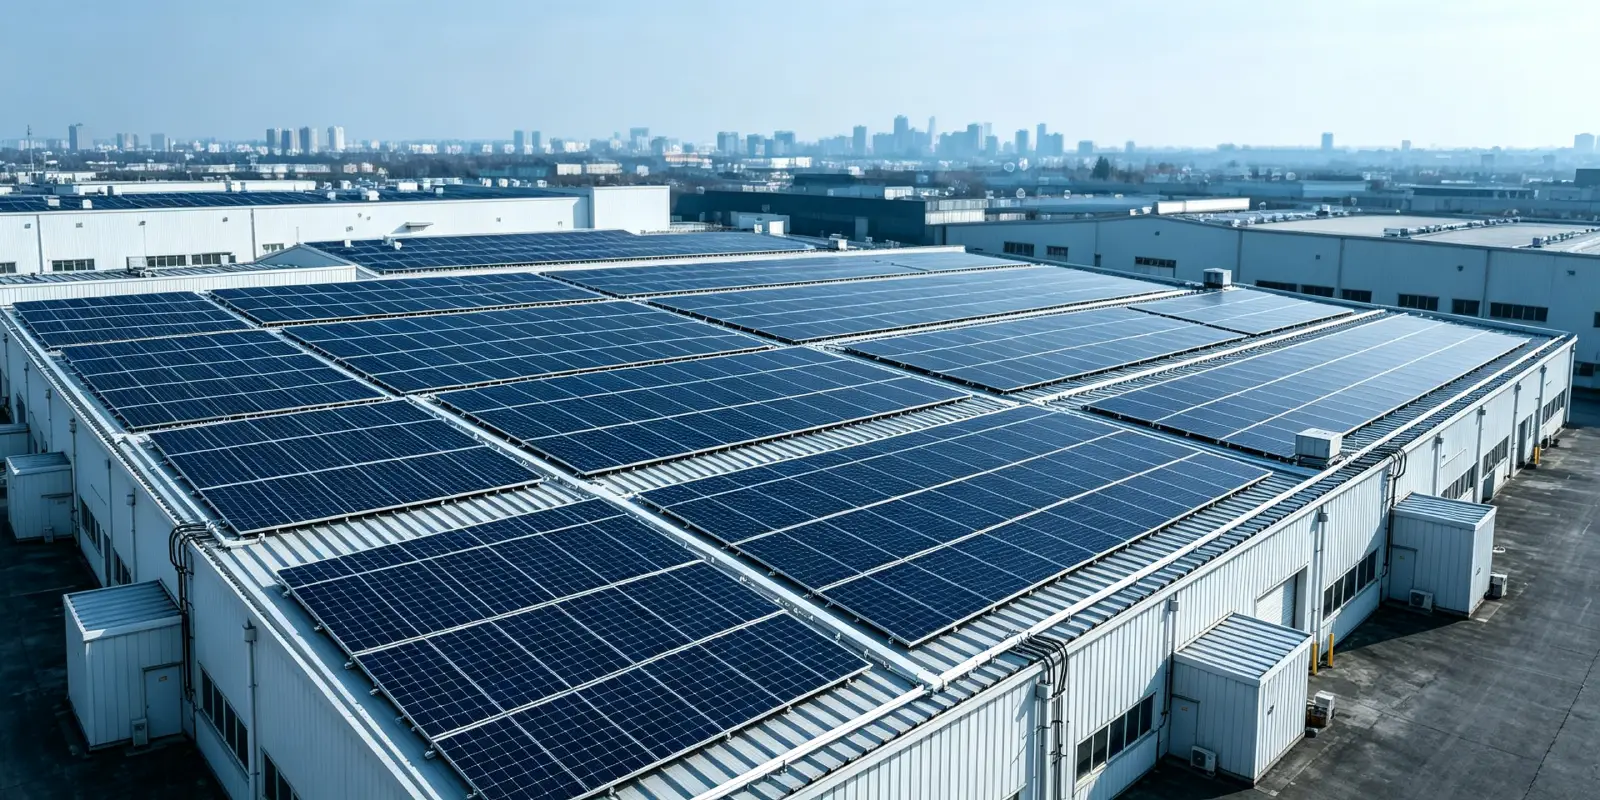
If you’re trying to figure out the commercial solar ROI for warehouses you operate, you’ve probably already heard the sales pitch. But the real numbers are what matter.. You’ve heard the “zero down, immediate savings” line. But you’re not a residential homeowner—you’re running a business, and the numbers have to work before you commit.
The problem is that most “solar ROI” articles are written for people who don’t know what a kWh actually costs them. They talk about “going green” and “reducing your carbon footprint” without ever telling you how to figure out whether solar makes financial sense for your building.
This article is different. It walks through the actual numbers a warehouse operator needs to calculate payback: your load profile, your utility rate structure, your roof’s real capacity, and the financing options that determine whether you save money from year one or wait a decade to break even.
Quick Answer: Does Solar Actually Pay Off for a Warehouse?
Usually, yes—but only if you’re using power during the day.
Warehouses are one of the best commercial solar candidates because their peak energy use (lighting, HVAC, forklift charging, conveyor systems) happens when the sun is shining. A well-sized system can offset 60% to 90% of your daytime electricity consumption.
Typical payback period for a warehouse solar system: 4 to 7 years with cash purchase and the 30% ITC. With financing, cash flow positive from year one is possible, but total savings are lower because the lender takes a cut.
The single biggest variable is not the system cost—it’s your utility rate structure. If you’re on a demand charge tariff, solar alone won’t fix your bill. You need to understand how your utility charges you before you size anything.
The Only Four Numbers That Actually Matter
Forget the sales pitch. To calculate ROI for your warehouse, you need exactly four numbers:
1. Your daytime load profile (kWh)
Not your total monthly usage. Your usage between 8am and 6pm, when the sun is up. Pull 12 months of interval data from your utility. If you don’t have interval data, request it—most commercial meters record it whether you see it or not.
This number tells you how much solar generation you can actually consume on-site. Excess generation exported to the grid is usually credited at a much lower rate than what you pay for electricity. Every kWh you export instead of consume is a kWh you’re selling at wholesale and buying back at retail.
2. Your blended electricity rate ($/kWh)
This is your total annual electricity spend divided by total annual kWh consumed. It’s not the rate on your bill’s first page—that’s usually just the energy charge. Your real cost includes demand charges, transmission, distribution, taxes, and fees.
A warehouse paying $0.10/kWh for energy but $15/kW for demand might have a blended rate of $0.16/kWh or higher. That’s the number that determines solar savings.
3. Your roof’s usable area (square feet or meters)
Commercial rooftops are rarely fully usable. HVAC units, skylights, vents, fire access pathways, and shading reduce the available area. A common rule of thumb: usable roof area is 60% to 75% of total roof area.
Rough capacity estimate: 10 to 15 watts per square foot for a typical tilted or ballasted system. A 50,000 sq ft warehouse with 70% usable area has about 35,000 sq ft available—roughly 350kW to 525kW of solar capacity, depending on layout.
4. Your available capital or financing terms
Cash purchase maximizes ROI. But if you finance, the interest rate and loan term determine your actual cash flow. A 7-year loan at 7% has very different monthly payments than a 15-year loan at 5.5%.
For PPA or lease structures, your “ROI” isn’t a payback period—it’s the difference between your PPA rate and your utility rate, multiplied by annual generation. It’s still savings, but the math looks different.
How to Calculate Payback: A Real Example
Let’s run the numbers for a 200,000 sq ft warehouse in a moderately sunny region.
Step 1: Estimate system size
Usable roof area: 200,000 sq ft × 65% = 130,000 sq ft
Capacity: 130,000 × 12 W/sq ft = 1,560 kW (1.56 MW) — but that’s probably oversized for the warehouse’s load. Let’s size to consumption instead.
Step 2: Size to daytime load
Annual daytime consumption: 2,800,000 kWh
A 1 MW system in this region produces roughly 1,400,000 kWh/year. To offset 80% of daytime load, we’d need about 1.6 MW. Let’s assume the roof can support 1.2 MW and the rest is exported or curtailed.
For simplicity, let’s model a 500kW system—a more typical first-phase installation.
Step 3: System cost
500kW × $2.20/W = $1,100,000 gross
Less 30% ITC = $770,000 net
Step 4: Annual savings
System generation: 500kW × 1,400 kWh/kW = 700,000 kWh/year
Self-consumed portion (80%): 560,000 kWh
Exported portion (20%): 140,000 kWh
Savings from self-consumption: 560,000 × $0.16/kWh = $89,600
Export credit: 140,000 × $0.04/kWh = $5,600
Total annual savings: $95,200
Step 5: Payback
$770,000 ÷ $95,200 = 8.1 years
Hmm, that’s on the longer end. Let’s see what happens if the warehouse can consume 95% of generation on-site:
Self-consumed: 665,000 kWh × $0.16 = $106,400
Exported: 35,000 × $0.04 = $1,400
Total annual savings: $107,800
Payback: 7.1 years
Still not the 4-5 years the salesperson promised. Why? Because at $0.16/kWh blended rate, the savings per kWh aren’t high enough to overcome the system cost quickly. In a market with $0.25/kWh commercial rates, the same system would pay back in 4.5 years.
The lesson: ROI is driven by your utility rate, not by the solar system.
The Demand Charge Trap Nobody Warns You About
Here’s where most warehouse solar ROI calculations fall apart.
Your utility bill has two main components: energy charges (per kWh) and demand charges (per kW of peak usage). Solar reduces energy charges by generating during the day. But it does not reliably reduce demand charges, because your peak demand might occur at 7am before the sun is strong, or at 6pm after it’s faded.
If demand charges make up 30% to 50% of your bill (common in industrial tariffs), solar alone might only address 50% to 70% of your total electricity cost. The payback calculation above—which used a blended rate—implicitly assumes demand charges are proportionally reduced, which isn’t always true.
The fix: Pair solar with battery storage to shave peak demand. But that adds cost, which extends payback. Or accept that solar addresses your energy charges while demand charges remain—which means your effective savings are lower than the blended rate suggests.
Before you sign anything, ask your utility for a demand charge analysis or hire an energy consultant to model it. This step alone can save you from a system that underdelivers on savings.
What About the ITC and Bonus Depreciation?
The 30% Investment Tax Credit (ITC) under Section 48E is the biggest financial lever for commercial solar. It’s available for projects that begin construction before January 1, 2025 (with a safe harbor) or are placed in service before December 31, 2027.
For a 500kW system costing $1.1M, the ITC is $330,000. That’s a direct dollar-for-dollar reduction in your tax liability. If you don’t have enough tax liability to use it in one year, it can be carried forward.
On top of that, 100% bonus depreciation allows you to deduct the remaining basis (after ITC reduction) in the first year. For a $1.1M system:
- ITC: $330,000
- Remaining basis: $770,000
- First-year depreciation deduction: $770,000 × 21% federal rate = $161,700 tax savings
Combined first-year benefit: $491,700—nearly 45% of the gross system cost recovered in year one.
But: Bonus depreciation phases down after 2026. And the ITC window closes at the end of 2027. If you’re seriously considering solar, the tax math favors acting sooner rather than later.
Financing Options and What They Do to Your ROI
Cash purchase: Highest ROI, shortest payback. But requires capital that could go elsewhere.
Bank loan / equipment financing: You own the system, keep the ITC, and pay over time. Effective rates vary widely. Watch for dealer fees that inflate the true APR. A “4.99%” loan might actually cost 7.5% after fees.
PPA (Power Purchase Agreement): Third party owns the system, you buy power at a fixed rate (usually below utility). Zero upfront cost. But you don’t get the ITC, and your long-term savings are lower. PPAs typically make sense for 500kW+ projects where the developer can achieve economies of scale.
Lease: Similar to PPA but you pay a fixed monthly amount regardless of generation. Better for smaller commercial projects (50–250kW) where the owner wants predictable payments and no responsibility for maintenance.
The bottom line on financing: If your goal is maximum ROI, cash purchase wins. If your goal is zero upfront cost and immediate savings, PPA or lease works—but you’re trading long-term upside for convenience.
How to Get a Real ROI Number for Your Warehouse
Step 1: Pull 12 months of interval data from your utility. Identify your daytime consumption and peak demand periods.
Step 2: Get your blended rate right. Total annual spend ÷ total annual kWh. Include demand charges.
Step 3: Get a roof assessment. Not a satellite estimate—someone needs to walk the roof and check structure, shading, and usable area.
Step 4: Ask for a production model, not just a system size. A real proposal shows monthly generation estimates and how they align with your load profile.
Step 5: Run the numbers with and without storage. If demand charges are significant, storage might be the difference between a 7-year payback and a 4-year payback.
Step 6: Talk to your tax advisor before you sign. ITC eligibility, depreciation schedules, and tax appetite vary by entity structure. Don’t assume you can use the full credit in year one.
The Bottom Line
Warehouse solar ROI is not a single number. It’s a function of your load profile, your utility rate structure, your roof, your financing, and your tax situation.
A 500kW system might pay back in 4.5 years in one market and 8 years in another—for the exact same hardware. The difference is everything around the panels.
Don’t sign anything until you’ve modeled your own numbers. And don’t trust a payback estimate that doesn’t account for demand charges, export rates, and the ITC timeline.
If you want a real ROI estimate for your warehouse, start with your interval data and your utility bill. Everything else is guessing.
Quick recap
Warehouse solar returns hinge on your load profile and utility tariff. Demand charges can drastically change your payback. Lock in the 30% ITC before the 2027 deadline. Always do an on-site roof assessment and financial modeling before committing.
About GTPOW | Gaotu Innovation
We’re your trusted solar solution provider. We offer customized commercial solar systems, OEM & ODM services, and end-to-end support for North American businesses. Reach out to discuss your rooftop solar project today.
Website: gtpowsolar.com
Related Posts

Foldable Balcony Solar Kit Wholesale for Global Distributors
1. Booming Global Demand Trend for Foldable Balcony Solar Kits The global renewable energy market…

Solar Panel Cleaning Guide: Why, When, and How to Clean
Zero waste and zero pollution are the core principles driving global development today. People everywhere…

20000 Swift Power Bank – Exclusive Wholesale Catalog
1. Market Pain Points & Sales Logic Battery anxiety is a widespread consumer problem that…


Leave a Reply